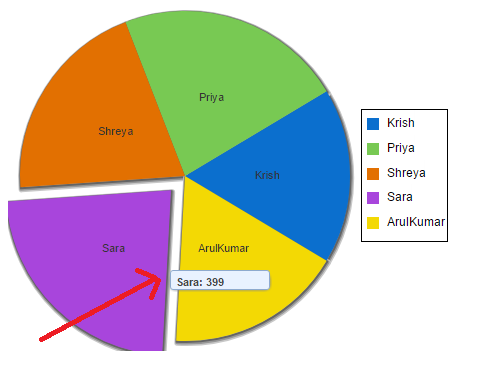
In salesforce report is the standard functionality to view details based on the criteria with a different type of representation. The dashboard is used to view the report in pictorial representation. If you need to view the dashboard through coding, you can use the below code. Compare with your standard dashboard, this one looking nice and comfortable to view details.
Visualforce Code :-
<apex:page controller=”StudentChartController” title=”Pie Chart Diagram” sidebar=”false”>
<apex:chart height=”300″ width=”400″ data=”{!stuData}”>
<apex:pieSeries dataField=”data” labelField=”name”/>
<apex:legend position=”right”/>
</apex:chart>
</apex:page>
Apex Class :–
public class StudentChartController{
public List<Student__c> str=new List<Student__c>();
public List<String> lival=new List<string>();
public List<PieWedgeData> getstuData() {
str=[select id,name,marks__c from student__c limit 5];
system.debug(‘str’+str);
List<PieWedgeData> data = new List<PieWedgeData>();
for(Student__c s:str){
system.debug(s.name+”+s.marks__c);
data.add(new PieStuData(s.name, s.marks__c));
}
return data;
}
public class PieStuData{
public String name { get; set; }
public decimal data{ get; set; }
public PieStuData(String name, decimal data) {
system.debug(name+”+data);
this.name = name;
this.data= data;
}
}
}
Result:-
We are the ISV Partners and Please reach us for custom development => www.merfantz.com
——————————- Happy coding Thank You——————————–


